
Infections are increasing across the UK, in a wave driven by the Omicron BA.4 and BA.5 variants
The number of patients in hospital with coronavirus has surpassed 10,000 in England for the first time since April, according to the latest NHS figures – rising by more than a third in a week.
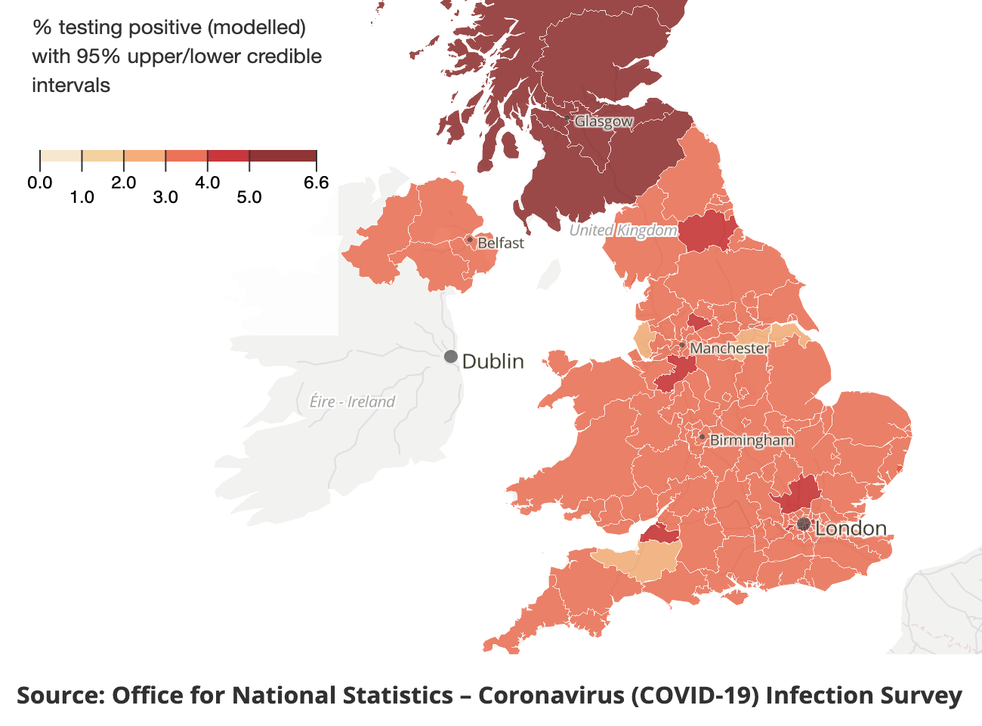
While the number of people dying with Covid-19 remains low compared to previous peaks, infections are rising in all four UK nations, according to the Office for National Statistics (ONS).
The latest wave is being driven by the newer variants Omicron BA.4 and BA.5, which are more transmissible than other strains and are able to evade the immune protection built up by vaccines or previous infections.
There is “currently no evidence” that BA.4 and BA.5 cause more serious illness than older variants of the virus, according to the UK Health Security Agency (UKHSA), suggesting the numbers of people dying or in intensive care units are unlikely to reach the sort of levels seen during the first year of the pandemic.
But the growing prevalence of the virus is expected to lead to extra pressure on hospitals, which are already facing a record backlog of patients needing treatment, besides causing widespread workforce absences and disruption across the UK.
Recommended
- UK’s rising Covid cases compared to other countries
- Which Covid variants are spreading around the world?
- How long are you infectious for Covid?
The virus was most rife in Scotland, with one in 18 people estimated to have the virus in the week to 24 June, according to the latest ONS calculations, which are based on nose and throat swabs from a representative sample of tens of thousands of people.
In England – where figures showed cases rising in every region – and in Wales, one in 30 people are calculated to have had the virus that week, rising to one in 25 in Northern Ireland, the statistics agency found.
But at a more local level, infection rate figures from the UK Health Security Agency (UKHSA) – which are less accurate, as they rely on people reporting their positive test results to the government – paint a slightly different picture.
According to the latest UKHSA data, all of the 10 local authority areas with the highest number of infections per 100,000 people were in southern England save for two – Barrow-in-Furness, in Cumbria, and Broadland, in Norfolk.
Here are the areas with the highest and lowest rates of infection per 100,000 people, according to UKHSA testing data, in the week to 26 June:
Local authority | Number of cases | Infection rate (per 100,000 people)
Highest
- Cambridge – 584 – 467
- Isle of Wight – 564 – 396
- South Cambridgeshire – 601 – 373
- Barrow-in-Furness – 218 – 326
- Vale of White Horse – 445 – 322
- Oxford – 480 – 316
- Basingstoke and Deane – 544 – 306
- Fareham – 347 – 298
- Test Valley – 373 – 293
- Broadland – 385 – 291
Lowest
- Oldham – 262 – 110
- Pendle – 102 – 110
- Kingston upon Hull – 315 – 121
- Barking and Dagenham – 268 – 125
- Newham – 445 – 125
- Birmingham – 1,518 – 133
- Sandwell – 446 – 135
- Tamworth – 105 – 136
- Bradford – 747 – 137
- Mansfield – 154 – 140
Additional reporting by PA
More about
COVID-19 Coronavirus NHS England Scotland Wales Northern Ireland Omicron
Leave a Reply